DATA VISUALIZATION TOOLS
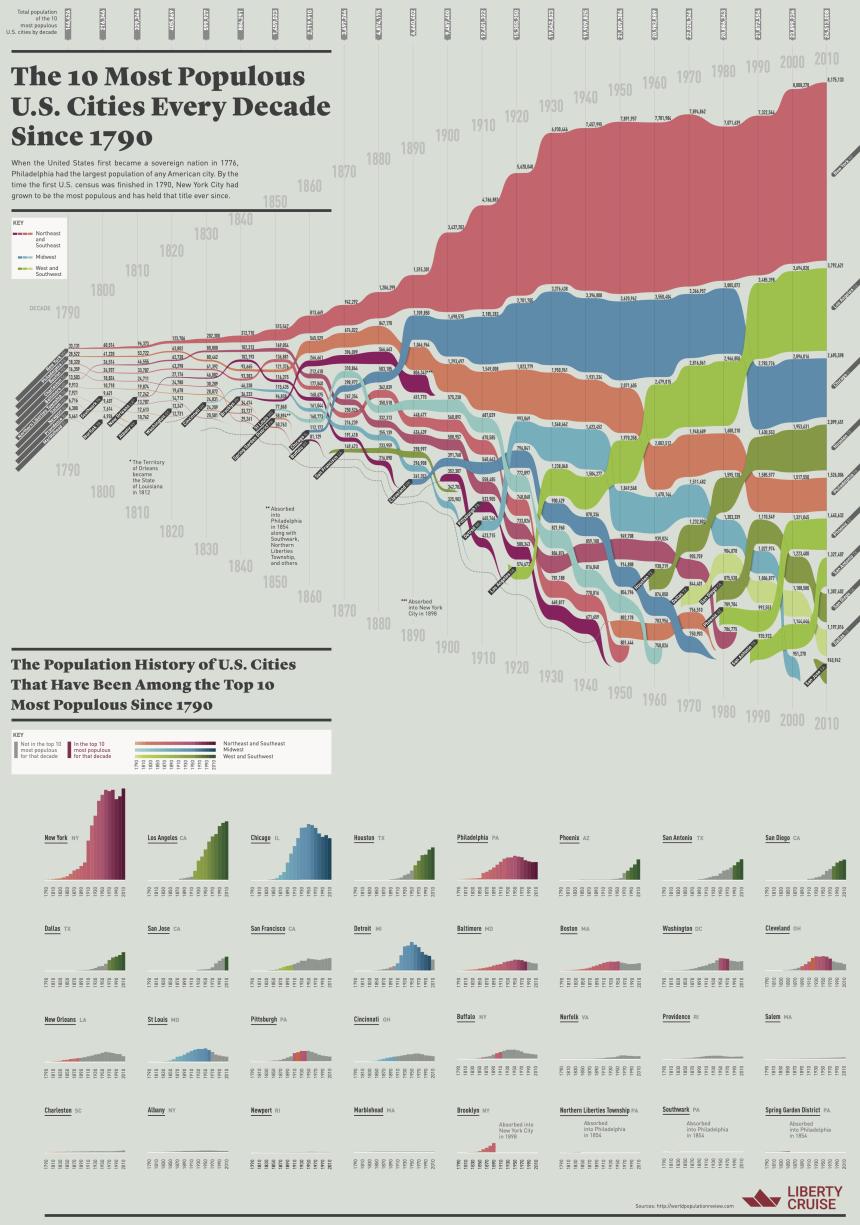
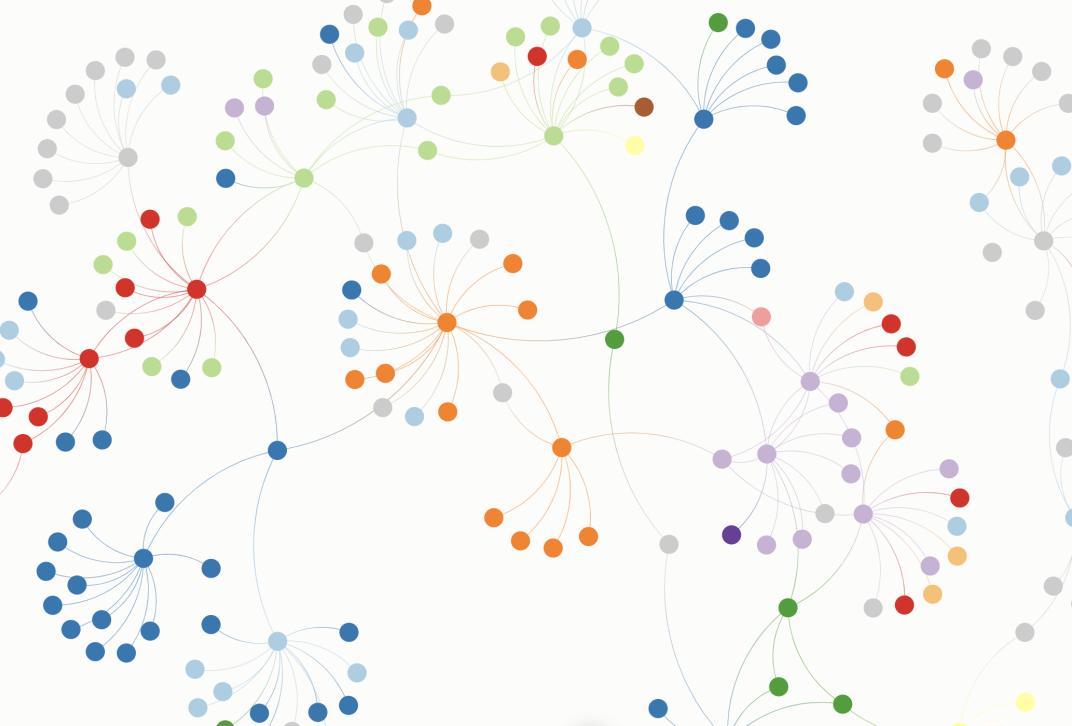
Interpret large sets of data from artifacts, such as texts, maps, images, and inventories as visualizations in graphs, charts, dashboard, infographics, and more. These tools may reveal patterns in the data that may otherwise be overlooked if simply looking at the data.
Datawrapper
Visualize data as interactive charts, maps, and tables. Learn more about Datawrapper.

RAWGraphs
An open source data visualization framework built with the goal of making the visual representation of complex data easy for everyone. Learn more about RAWGraphs.

Tableau Public
Connect spreadsheet or file to the tool and create interactive data visualizations for the web. Learn more about Tableau Public.

